This data could eventually lead to road improvements on dangerous roads.
SAN ANTONIO — Editor’s Note: The High-Injury Network Dashboard reflects traffic crash data from 2018 to 2023.
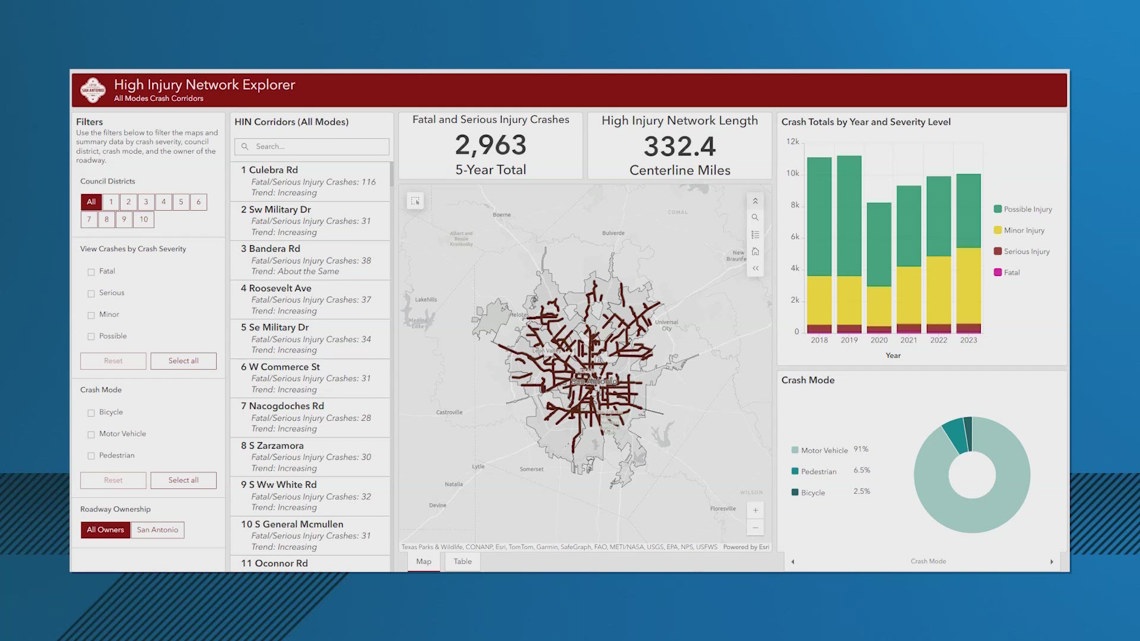
The City of San Antonio Transportation Department has launched a new interactive High-Injury Network (HIN) Dashboard that allows the public to see where the city’s most severe and fatal traffic crashes are occurring.
The online tool maps a small percentage of streets that account for a disproportionate number of serious injuries and deaths, with data showing how crashes affect pedestrians, bicyclists, and drivers. Users can view high-injury corridors by City Council district, neighborhood, or frequently traveled routes.
Transportation Director Catherine “Cat” Hernandez said the dashboard gives residents greater insight into local traffic safety issues and supports the city’s “Keep Crossings SAfe” campaign, which focuses on improving safety at intersections and crosswalks.
Launched near the end of 2025, the campaign targets locations where many severe pedestrian crashes occur. City officials say the dashboard reinforces the effort by highlighting high-risk intersections and corridors and helping residents understand the impact of unsafe driving behaviors.
“We want people to be paying attention when they come to a crossing, make sure they’re stopping, make sure they are watching out for pedestrians. Then at the same time, we want to make sure pedestrians are crossing safely as well, and using crosswalks and not just jumping out into the middle of the street,” said Kristie Flores with Vision Zero.
The dashboard also supports San Antonio’s Vision Zero goal to eliminate traffic deaths and serious injuries through data-driven strategies.
The High-Injury Network Dashboard is now available to the public.